Adventures in Time & Space
I am guessing that if you have read this far, you’ve worked with data before. You are somewhat familiar with looking at rows of data neatly organised into columns in a spreadsheet. So maybe that’s where we should start. An excel file presented as a table that describes all of the oil and gas wellbores in New Zealand. In this case I’ve loaded the excel into the Trifacta Dataprep software to enable me to do some tidying up of the data, not that this beautiful baby really needed any ehnacement.

Sheesh. So much for the big build up. We’ve been talking about beautiful geology, exotic locations, and 140 years of human endeavour and activity. And then we are presented with a dull library list of records.
Yet, this is where it begins. Or at least where it begins for about half the data in the pack. But before we dive deeper, let’s take a step back and look at the why’s and how’s of the oilfield exploration business that led to the acquisition of data in the pack.
Broadly speaking, the business of exploration and production of oil and gas assets consists of making maps of the structures in a geological basin with the aim of identifying prospects that might be traps for hydrocarbons (oil and gas). With these maps in hand, the operating company will then prove, develop and produce from those prospects by drilling deep wellbores that connect subsurface reservoirs to facilities at the surface.

This alluring map of the physical geography of a section of the new Zealand coastline hints at some of the complexity of managing spatial data. Aside from the wonderfully rendered geographic image that integrates observable (onshore) and normally hidden (offshore, subsea) features in a single display, there are two coordinate grids … and one isn’t even square! We will discuss the subtleties of positioning in a future post. For now, just consider that surface maps provide some of the most important context for almost all real world data.
When prospecting for hydrocarbons, we have look beyond the familiar street map data of our near neighbourhood and look at Geological structures. Geological maps are made from large scale surveys of surface and subsurface features. At the surface we can use satellite imagery and aerial photography as well as local surveying. For the subsurface we build maps of large areas using geophysical surveys - mostly commonly seismic reflection surveys.

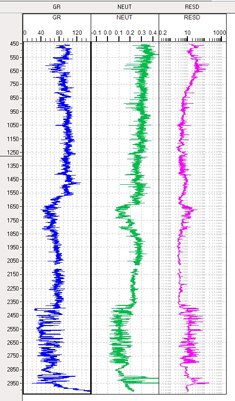
These large scale maps and surveys provide possible images of prospects, based on models containing large amounts of uncertainty that are proven by the act of drilling wells. When we drill wells, we perform down hole surveys (known as ‘well logs’ and ‘well tests') that provide direct measurements of the layers of rocks leading down from the surface to the prospective hydrocarbon reservoir. Most of these activities are recorded using a combination of structured information destined to be read by complex applications and unstructured information held in documents designed to be read by humans.
Of course, this distinction between structured and unstructured data isn’t really a hard and fast split. Documents often contain lots of structured information in maps, logs, tables and forms. And structured information in acquisition files and technical application formats often contain a great deal of ambiguity, uncertainty and interpretation that require human attention to comprehend.

When we look at data from the perspective of its subject matter, we are said to be considering the ‘domain’ aspects of the data. If we limit ourselves to only looking at the domain, we’d be stuck with the pretty web page that guides us as a domain data consumer. As data specialists, we have loftier ambitions. We want to lift the lid on the data and really grok the content for fun and profit (mostly fun in this case, as I have little personal interest in producing oil in New Zealand).
From a specialist viewpoint, further consideration of data in our pack might include:
Master data - the top level lists of stuff that we hang everything else off, such as list of seismic surveys and wellbores.
Reference data - the lists used to classify and categories attributes of other data; and
Work product data - the actual data recorded from field data acquisition activity - events in time that produce measurements. This is akin to the ‘transactional’ data in commercial data management systems.
The dull spreadhseet at the top of this page is the master data list of wellbores, containing work product information such as the surveyed location of the top of the hole, event details such as the date the well was initiated (‘spudded’), and reference data such as the classification of the status of the well and the type of fluids that it produces.
Let’s end this first part of our journey by transforming the dull table into something a bit more interesting to regular humans. Let’s use Microsoft’s PowerBI to perform a simple visualisation of the dates of drilling of wellbores in New Zealand since 1866, that let’s us filter in both time and space.


The remarkable thing about this report, is that with 30mins of work in a commodity software package, I am able to directly visualise photographs of the specific location of every well drilled in New Zealand in the last 140 years. I can see how the activity built up over time, I can see when the industry became active and managed to produce oil and gas, I can see how the activity is distributed across the geography and I can directly observe, with photos how well (or not) the players in this game have managed some of the impact of heavy industry on these beautiful islands.
Unfortunately, I can find no record of the entrance to the Mines of Moria.